Identifying L7 DDoS Attacks(part2): Monitoring and Analyzing
 Back
Back
This article is divided into two parts, below is the full content:
- Why is the dashboard an essential tool for stopping L7 attacks? (Part 1)
- What are the essential visual charts? (Part 1)
- How to use the charts to determine the presence of abnormal traffic (DDoS attacks)? (Part 1)
- How to check CDN caching performance? (Part 1)
- How to understand the status of CDN defenses (WAF)?
- What is Origin Latency?
- The importance of “custom” dashboard
DDoS Defense: Checking CDN’s Defense by Request Trends
From the dashboard of the all-in-one CDN management platform, one must be able to check the request information and Http code response status of a specific domain to assist in evaluating CDN defense performance.
1. Check Domain’s Request Status
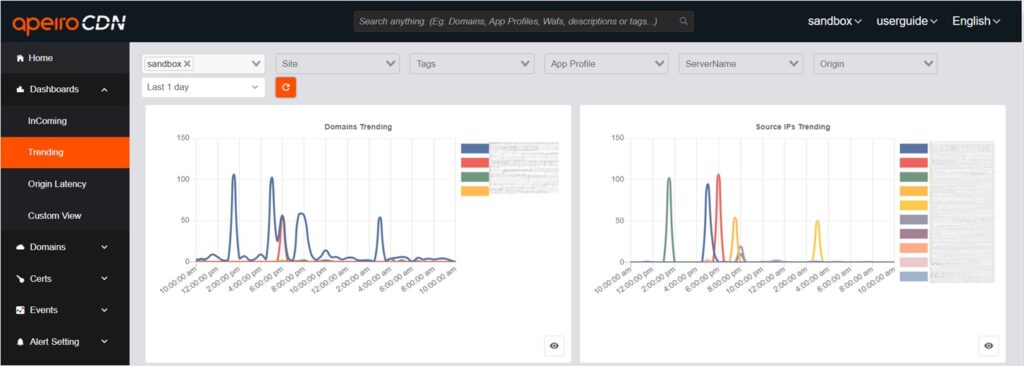
Check the request status of a domain: use filter to specify domain, then use the Domains Trending & Source IP Trending charts to determine the condition of the IP accessing the domain.
Domains Trending: The line chart allows you to view the top 10 domains with the highest traffic on the CDN.
Source IPs Trending: The line chart displays the top 10 IPs accessing the domains.
For example: Use filter to find the target domain, then use the Source IPs chart to see the request volume from each IP visiting the domain. Suppose when checking abc.com, you noticed that the requests from IP: 1.2.3.4 are abnormally high for this domain, almost doubled that of the Top 2 IP. In this case, you can determine that 1.2.3.4 is suspicious of initiating an attack on the normal domain. Additionally, the timeline on the reports can be further analyzed to identify any abnormal spikes in traffic from the domain or IP over time.
⬛ Recommend: Exploring Botnets: Mechanisms, Varieties & Defense Strategies
2. Analyze Http Code Trends
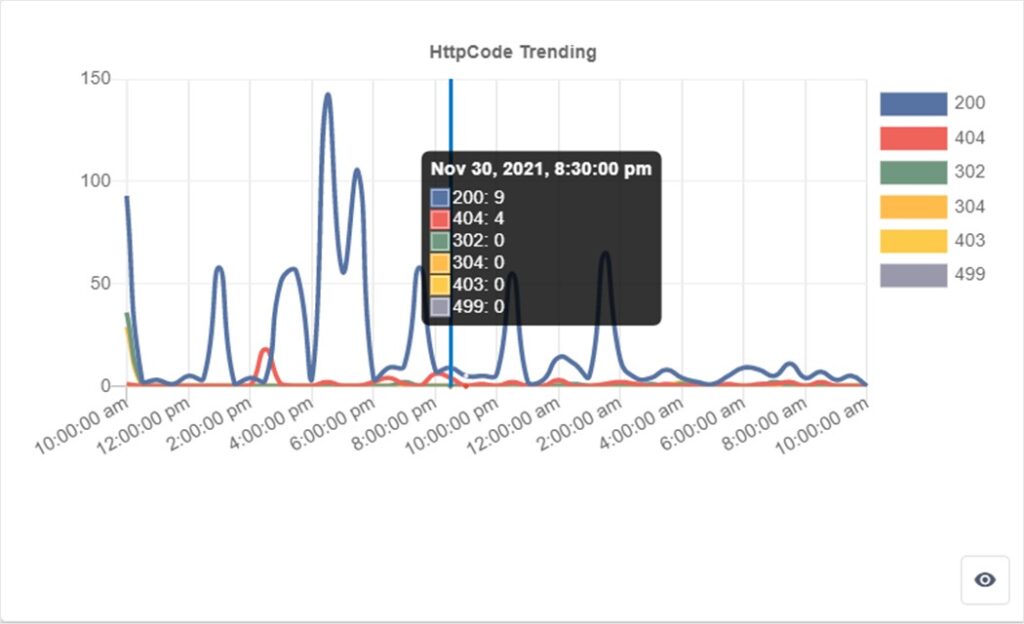
Http status code trend: you can observe the Http code events from the Http status code trend line chart, such as the number of responses with Http code 200, and obtain the data on current normal requests. At the same time, you can learn about CDN defensive status from the Http codes.
For examples:
200: if the number of Http code 200 responses show abnormal spiking within a certain time interval, it could be determined as an attack and WAF rules can be directly set up on the platform.
403: you can observe the number of Http code 403 after configuring WAF rules to determine whether WAF has been effective.
3. How to Understand “Http Status Code Upstream Response Time”?
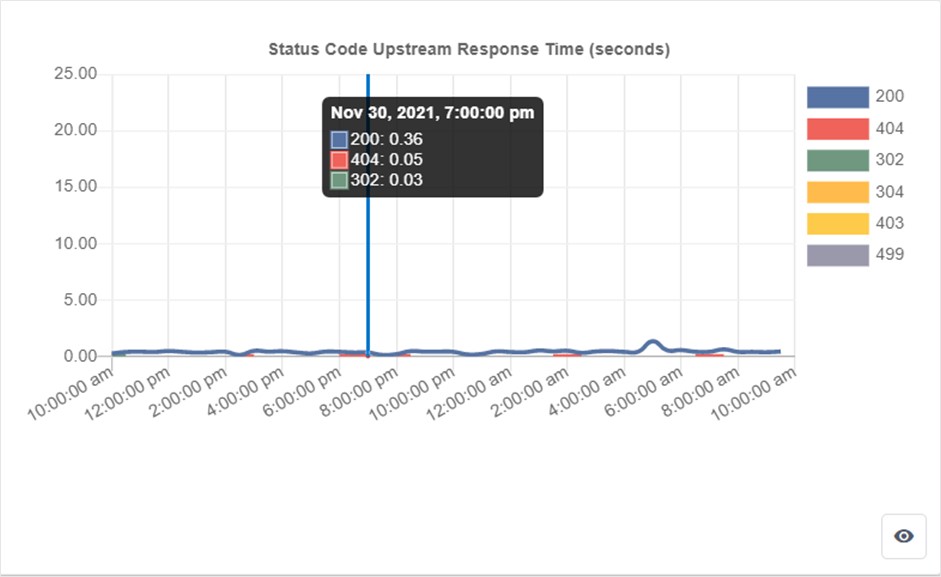
Status Code Upstream Response Time (seconds): you can observe the average time it takes for the origin servers to return the Http status code. For example, for HTTP status code 504, this feature allows for a quick check to determine if the origin server exceeds the default 60-second timeout.
For example: use this data to determine whether the responses from the origin servers are abnormal. When an HTTP status code 499 occurs, it indicates that the origin server’s response time might be too long (over the 60-second timeout limit), and the client prematurely ends the request, which disconnects the CDN with the origin servers and returns a Http code 499. You can then determine that the origin servers have taken too long to respond.
Method:
- Adjust the Upstream Timeout in CDN settings to increase the default value from 60 seconds to 120 or 180 seconds.
- If timeouts persist despite a 180-second timeout value and the origin server’s response latency is normal, and the HTTP code 499 indicates the origin server’s response, contact the administrator to inspect the origin server.
ApeiroCDN: DDoS and Origin Latency Monitoring (Exclusive)
From the origin latency chart, you can monitor the quality of the origin connections; poor quality will directly affect the website browsing speed at the user end, and higher latency may even result in timeout, negatively impacting the user experience and business performance of the website. Let’s try to understand the origin latency chart!
1. Check on Origin Latency
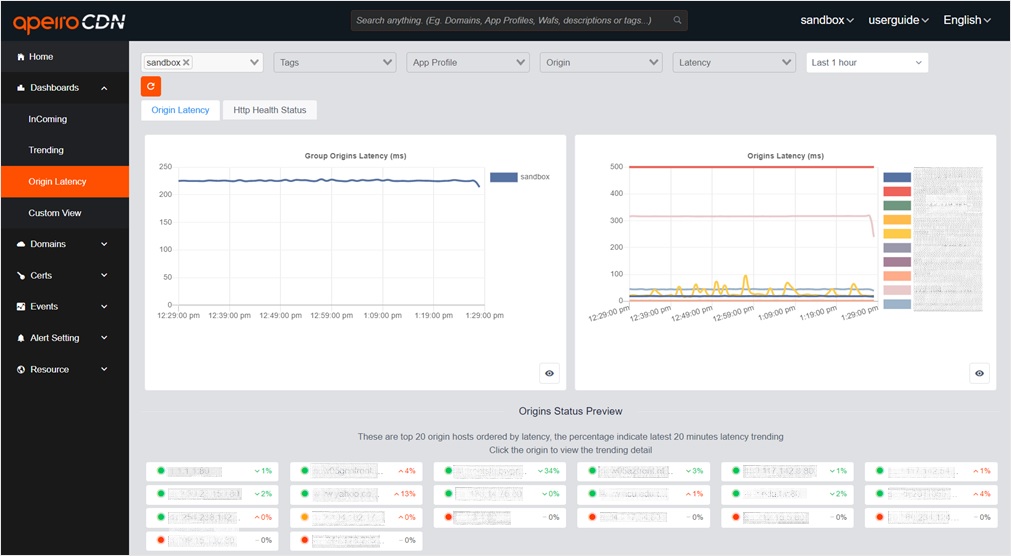
Group Origins Latency (ms): use this to see whether the overall CDN origin server latency has shown any anomalies within a specific time period.
For example: to check on the overall network quality of the origin servers, you can use this chart to observe the differences in latency compared to historical data.
⬛ Recommend: How to Tell if a Domain Name Is Blocked by GFW of China
2. Monitoring Latency of Specific Origin Servers with Filters
Origins Latency (ms): use this chart to check on the origins latency of Top 10 domains.
For example: Using www.ncu.edu.tw as the origin server, you can check the latency between the CDN edge and the origin server by Origins Latency chart. You can observe any abnormal fluctuations in Origin Server1 within a specified time period. Additionally, with Origin Status Preview, you can view the percentage increase or decrease in various ports2 configured for that origin server compared to the previous 20 minutes.
Note 1 and 2: in this example, the domain is the origin server; an origin server can either be a domain or IP. When the equipment networks connect with each other, a specific port must be configured for protocol to use, such as http(80)/https(443). From this chart, you can monitor the percentage of origin server latency on two ports simultaneously, as well as comparing them with the value 20 minutes ago.
3. How to Determine If the Origin Servers May Be Unavailable?
Origins Status Preview: use this data to check the origin servers’ latency changes shown in percentage by comparing with that of the latency 20 minutes ago, and even you can check on the latency status of origin server ports that were configured on the origin servers.
For example, if we take www.ncu.edu.tw as the origin server, and we want to check the latency of CDN edge to www.ncu.edu.tw:1234 and www.ncu.edu.tw:9443, we can observe that the latency has remained at 500ms within the past day. Based on this, we can conclude that the origin server is unavailable.
⬛ Recommend: Choose a CDN Vendor: The Best Technical Questions to Ask
DDoS Defense: Customized Dashboard Necessity (Exclusive)
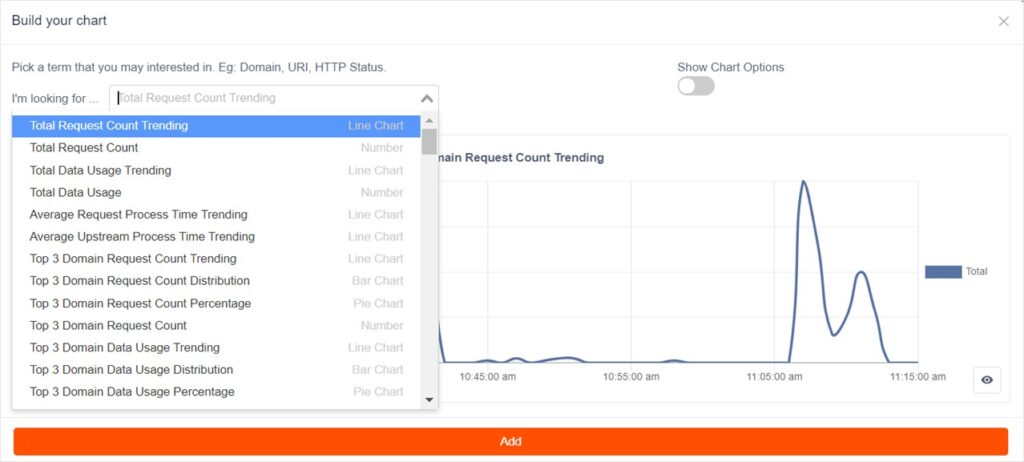
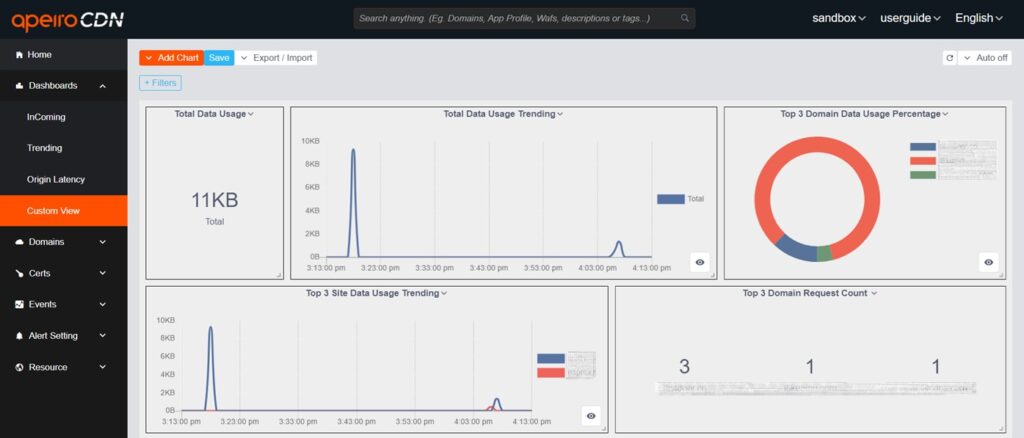
Why is custom (personalized) dashboard necessary? After years of practical experiences defending against DDoS attacks, we concluded that since the attack patterns and business needs of customers differ from each other, they would require different types of data analysis. That is why we created the self-definable dashboard to realize the need for personalized services. ApeiroCDN management platform offers the most comprehensive request information and provides over 150 types of on-demand data charts, as well as customizable data for personalized charts. The interface of the dashboard can be customized at the same time to allow faster and more precise decision making on the incoming types of attacks.
⬛ Recommend: WAF (Web Application Firewall) vs. Firewall: Explained
1. How to Import and Export Dashboard?
The data on the dashboard can be exported and retained as Json file format by using the Export function. Users can even edit the Json file and re-import into the dashboard. For example, we can change the name of Chart Title: Country_Data into Country_Data_2 and create a new dashboard by pasting and importing the Json file.
The dashboard of the all-in-one management platform of ApeiroCDN can achieve comprehensive data analysis, whether it’s Frontend (Client-CDN) or Backend (CDN-Origin servers).
- Frontend (Client-CDN): customers can view the status on daily request volume and analyze anomalies with the data on the dashboard. Furthermore, when blocking abnormal request volumes using the CDN’s WAF, they can instantly check the effectiveness and efficiency of the WAF blocking.
- Backend (CDN-Origin servers): customers can check on the connection quality of CDN to the origin servers and quickly identify which origin server is abnormal.
⬛ Recommend: Exploring Botnets: Mechanisms, Varieties & Defense Strategies
ApeiroCDN’s All-in-one CDN management platform possesses many exclusive functions including: the most sophisticated WAF in the industry, most comprehensive request log, exclusive visibility on the latency between CDN and origin servers, customizable monitoring dashboard, and 24/7 live technical customer support services. With a single interface for all data analysis needs, it becomes the strongest defense against DDoS attacks. Delivering both speed and security, ApeiroCDN ensures an excellent experience for your users, no matter where they are.
Content of Part1:
- Why is the dashboard an essential tool for stopping L7 attacks?
- What are the essential visual charts?
- How to use the charts to determine the presence of abnormal traffic (DDoS attacks)?
- How to check CDN caching performance?
⬛ Recommend: CDN Services: Inside the 24/7 DDoS Security Center


